Since filebeat 5.3, there is an add-on feature named as “modules“. We all know how easy to setup a filebeat to ingest log files. We also know how to apply “pre-processing” on the incoming documents / events by configuring ingestion pipeline(s) on an elasticsearch ingest node. Then why do still need to check the “modules” out?
modules in a nutshell
A filebeat module makes the following easy:
- data / log collection based on a common known format / software,
- log parsing, and
- visualisation of the log(s)
For example, you have a MySQL instance running inside your architecture and you are currently using just filebeat + ingest nodes to do the pre-processing and ingestion. It is not really that tedious if you know MySQL log formats well. Unfortunately not everybody is such an expert and so you probably need to overcome a short learning curve to create the ingestion pipeline and get the logs parsed correctly. Secondly, what if the future release of MySQL changed their log formats? It is not likely but possible right? By then you would need to overcome that short learning curve again.
The above reasons make sense at once to use filebeat module(s) to ingest logs from a common known format / software. In this blog post, we would be using filebeat to ingest MySQL slow log through “modules“.
PS. the filebeat version I am using is 6.3.2
Activate slow log feature on MySQL
Depends on your MySQL distribution, you might need to activate the slow log feature. My local version for MySQL is 8.0.12; the first thing is of course start up your MySQL instance (execute mysqld executable on unix based platforms or simply start the service on Windows platform). Next is to run a couple of commands inside a mysql shell.

- SET GLOBAL slow_query_log = ‘ON‘; => turn the slow log feature ON; to turn the feature off set it to ‘OFF’
- SET GLOBAL long_query_time = XX; => XX is the number of seconds elapsed for a query to run through and treated as slow. If setting this value to “0“, it means that all queries would be treated as “slow”; since this is for demo purpose such a setting is acceptable but for production… do change it to something meaningful
Now the settings are configured, you would need to restart the MySQL instance to make the changes realise (restart the mysqld executable or restart the MySQL service on Windows platform)
Enable filebeat MySQL module
Navigate to the filebeat root folder and you would be able to see a folder named “modules.d“, inside this folder is a set of configuration files and each representing a common known log format including MySQL. One interesting thing is that all the configuration files are ended with “.disabled” suffix and as they said… the ingestion feature for these log formats are disabled at the moment. We need to activate the corresponding module by running a simple command:
./filebeat modules enable mysql
To verify if the above enablement is correct, there are 2 ways:
- check the “modules.d” folder and there should be a “mysql.yml” instead of the previous “mysql.yml.disabled” one OR a more professional way…
- run ./filebeat modules list

Setup Ingestion pipeline, Dashboard and mapping templates
As said the corresponding module contains the logics to collect logs, parse them and also to visualize them; but in order to make this happen, we need to setup by running the following command:
./filebeat setup
PS. by default if you didn’t specify a configuration file for filebeat to run against, the default config file is “filebeat.yml”
PS. as configured in the “filebeat.yml”; the default elasticsearch url is “localhost:9200” and the default kibana url is “localhost:5601”; if you have setup your elasticsearch or kibana using different IP address or port number then you would need to either update this config file directly or to create a separate config file
PS. if you ever need to create your own config file and wants filebeat to use it; add a “-c” option => ./filebeat setup -c my_config.yml
The missing piece… mysql.yml
Before we can run our filebeat for MySQL log ingestion; we need to configure the path where slow log(s) are located. Open the mysql.yml under {filebeat_root}/modules.d folder. Add back the corresponding path details like the following:
- module: mysql
  # Error logs
  error:
    enabled: false
    var.paths: [ "/data/mysql.err" ]

  # Slow logs
  slowlog:
    enabled: true
    var.paths: [ "/data/mysql-slow.log" ]
As you can see, we disabled error log ingestion; but enabled only slow log ingestion. The interesting part is the “var.paths” in which it indicates where your corresponding slow log files are. In actual, if you do not set “var.paths”, filebeat would try its best to search for slow log files based on the default folder of your OS distribution. However to play safe, it is a good practice to set the paths especially when you have configured your MySQL instance to use different mount points to store logs.
Test Drive time~
Now everything is set; let’s do a test drive.
./filebeat
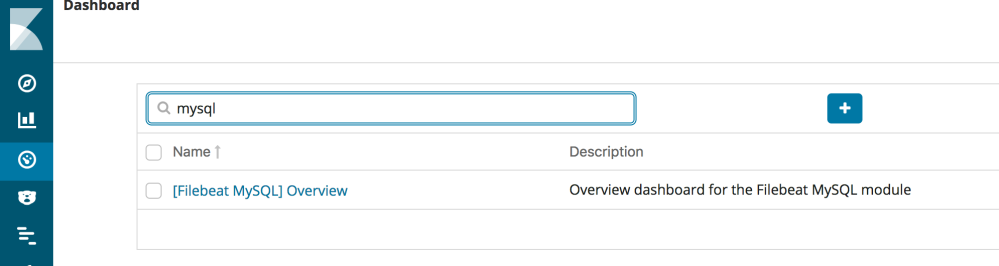
You should see some debug logs telling you filebeat has been started up and inits the MySQL module etc. To verify the results, open kibana and check for the corresponding dashboard.

Cool~ Quick and Easy, now we have just ingested the MySQL slow logs to elasticsearch with a built-in dashboard to show the data.
